
The Effect of Water and Biochar on the Growth of Cherry Belle Radishes

Acknowledgements
I would like to thank Professor Tom Marrero for partially funding my Honors project. Without his help I would not have been able to complete this experimental study. He has been an excellent professor and advisor in my three years of Undergraduate Research. I would also like to thank Tony Marrero and Wakefield BioChar for providing some of the materials needed to complete this experiment, as well as Bluebird Composting for providing the soil and compost. Lastly, I would like to thank my family, friends, and significant other for their support during this past year of research.
Research Advisor: Professor Tomás R. Marrero, P.E. and Fellow of the American Institute of Chemical Engineers
[SOME IMAGES MAY NOT BE AVAILABLE THROUGH THIS POST. PLEASE CONTACT WAKEFIELD BIOCHAR IF YOU WOULD LIKE A FULL COPY OF THIS REPORT.]
Abstract
Information was gathered through internet searches and scientific papers. Experiments were performed to compare the effects of the two variables. Daily, water was added to each pot simulating conditions ranging from drought to heavy rainfall. The amount of water given daily was divided into five categories, 5 mL, 10 mL, 15 mL, 20 mL, and 25 mL. The amount of biochar in the soil was also divided into five categories consisting of 5%, 8%, 10%, 12%, and 15% by volume. All of the radish plants, 60 in total, were grown under grow lights indoors for 22 days. All of the trials were designed in accordance to the Central Composite Design data analysis method. Observations of final radish plant height, root length, weight, and percentage of germination were quantified using the two independent variables. It was found that the optimum growth conditions were 25 mL of water daily, and 10% biochar in the soil. The results of this experimental study will help farmers on both large and small scales improve crop productivity and soil quality, as well as help mitigate the effects of climate change.
Introduction
The following discussion of Biochar describes some important background information and past research on the variables that will be affecting the experiment that is described below.
Figure 1. Biomass Availability in the United States from Crop Residues There are three different levels for testing the Biochar. The Biochar is considered level one if it has been tested for the most basic requirements and it only applies to Biochar that is made from unprocessed Biochar. The Biochar must also meet the carbon ratio minimums as well as have the correct proportions of hydrogen, carbon, and nitrogen.1 Level two Biochar must meet some basic soil toxicity thresholds in addition to meeting all of the requirements for level one Biochar. All of these requirements must be met regardless of whether the Biochar was produced by processed or unprocessed feedstock. In addition, level two must meet soil enhancement chemicals of nitrogen, phosphorous, and potassium, as well as pass the electrical conductivity test.1 For Biochar to be classified as level three, it must pass more advanced toxicity limits as well as meet all of the requirements outlined for level two Biochar. This Biochar needs to pass all of the requirements regardless of whether it was made from processed or unprocessed feedstock advanced toxicity is reported in regards to concentrations of volatile aromatic compounds. Advanced soil properties involve porosity and surface area of the Biochar.
Applications
In order for the Biochar to be most effective, it should be located in the root zone of the plants.3 For agricultural purposes, this includes the top 4-6” of soil. The soil surface is where the majority of the nutrient uptake takes place, as well as where most of the microbial activity takes place. Biochar should also be thoroughly mixed with the soil to ensure that wind and water erosion is decreased.3 The Biochar should also be placed in a large enough area to ensure that the mature plant will be able to utilize the nutrients that the Biochar has to offer.
Figure 2. Annual Atmospheric CO2 Concentration 1960-Present
60 Cherry Belle Radish seeds
Biochar produced from yellow pine trees
Organic Compost
Top soil
Tap water
5 plastic seed starting trays
1 25ml beaker
Sylvania Super Saver, Cool White Deluxe Light Bulbs, 34W (in light fixtures)
1 humidity and temperature meter (ACURITE-Indoor humidity Meter- #00613)
1 Lumen Meter (Hydrofarm-Digital Light Meter-LG17010)
5 aluminum mixing trays (disposal baking trays)
60 paper fiber compostable starter pots
1 1L plastic bottle for holding water
1 1L measuring cup
1 step stool for safe access to elevated working area
Indoor temperatures ranging from 69-72 °C
Indoor humidity ranging from 15-32%
The top of the pots were approximately 30” from the light source
An average of 820 lumens at all corners of the planting area
Experimental Procedure
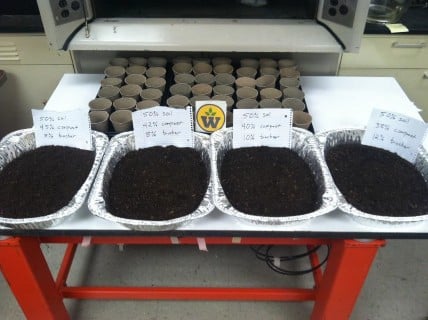
The first step to set up the experiment requires a two week incubation period of the biochar/soil/compost mixture. The proper volumes of the biochar, soil, and compost were measured out in the 1 L measuring cup, with a total volume of 3 L per variable. For example, for the 10% biochar mixture, there were 1500 mL of soil, 1200 mL of compost, and 300 mL of biochar. These three components were mixed together in the disposable aluminum trays and mixed thoroughly by hand. It is important to label each one of the trays to avoid an error in the experiment. Each day for 14 days, the mixtures were churned by hand to insure even distribution of the components within the soil. Also, 250 mL of water was added each day to maintain soil moisture. The daily watering and mixing were essential to allow the biochar to absorb the nutrients that the compost and soil contained. If the biochar was not allowed to incubate, it could have been in the absorption process while the seeds were trying to germinate, which could have decreased the amount of seeds that germinated. It is not necessary to incubate the control, as the compost and soil do not have the same interaction as the biochar does with the soil and compost. Figure 6 shows the aluminum trays containing the different mixtures during the incubation period.
Figure 6. Biochar Incubation Trays
At the end of the 14 day incubation period, the compostable pots were filled with the soil in the arrangement indicated in Figure 7. Each of the 5 biochar composition variables and the control were laid out in the same manner in individual plastic trays.
Figure 7. Radish Plant Layout
Once the setup is complete, the radish seeds are ready to be planted. One seed was planted per pot. The seed was placed in the middle of the pot on top of the soil, and either pushed
½” down into the soil, or ½” of soil was placed on top of the seed. After the planting is done, the seeds are ready to be watered. The plants were each watered once per day with the appropriate amount of water for 22 days. It is also important that the plants receive adequate light, so the lights were left on for 24 hours a day during the course of the experiment. The planted pots are shown in Figure 8.
Figure 8. Planted Radish Seeds in Pots
Data Collection
On the 22nd day of the experiment, the plants were watered like normal. After 8 hours had passed, the height of the plants was measured using a ruler, to the nearest mm. The number of leaves of each plant was noted, as well as the color of the stem of the plant. The pots were then easily torn away from the pots and the soil was removed. The soil was very carefully broken up in order to protect the plant and to avoid breaking the root. In order to remove the remaining soil from the root system, the plant was placed in a tub of water and gently rubbed to clean the roots. Then, the roots were dried on a paper towel to get rid of excess water. The length of the roots was measured, and the weight of the plant was taken to 4 decimal places on a digital scale. All of the data was entered in an Excel spreadsheet for analysis, which is summarized in the next section.
Data Reduction
Once all of the data were collected, it was analyzed for outliers. The averages of the trials were calculated, as well as the standard deviations. If the height or weight for the trial was not within three standard deviations of the average then it was eliminated. It is important to note that no outliers were found in this experiment.
Central Composite Design
Once the original design has been set up, it is essential to plot the trials in coded terms. Since there are two quantitative dependent variables, the interaction parameters of the
experiment fall within a two dimensional plane. The limitation of having only two variables allows the data to be easily interpreted using a program like Microsoft Excel, and does not require more complex programming such as MATLAB, or other software that can easily manipulate 3 or more variables. Central composite design relates the independent and dependent variables through interaction parameters based on the results of the experiment. It relates multiple inputs to a single output. From these data, other results can be predicted by interpolating and extrapolating the experimental results.
Results and Discussion
After the data is examined for outliers, the statistical method of central composite design was implemented. The first step in the process is to develop the design. Two different analyses took place during the process: the amount of water given and the amount of biochar in the soil.
Table 1. Selection of Variable Magnitudes
|
Variable |
Low |
Middle |
High | |
|
A |
Water Added (mL) |
5 |
15 |
25 |
|
B |
Biochar Composition (volume%) |
5 |
10 |
15 |
Variable Effects on the Growth of Cherry Belle Radishes
The next step was to take the factorial for each respective set to find the main effects for each output variable. This was done by multiplying the response by the factorial. The average of the highs and the average of the lows were taken. The main effects graphs can be seen in Figures 9-12. In these figures, the largest slopes have the largest effect on the final height, root length, and weight.
Figure 9. Height Effects on Radishes for Variables A and B
Figure 10. Root Length Effects on Radishes for Variables A and B
Figure 11. Weight Effects on Radishes for Variables A and B
Figure 12. Number of Germinating Seeds Effects for Variables A and B
As shown above, line A dramatically increases as the amount of water increases from 5 mL to 25 mL for height, root length, and weight, but does not affect the amount of germinating seeds as dramatically, although there is still an increase.
For variable B, the results are not as dramatic as variable A, but some important trends can be noticed. For the weight of the plant, the root length, and the number of germinating seeds, the low value of biochar, 5%, has the least impressive results on the dependent variables. The results improve for the middle value where the biochar is increased to 10%, but the results either remain stagnant or decrease for the 15% biochar high value. For the plant height above the surface, the biochar actually lowers the final height of the plant. This is because the biochar has a stronger interaction where it directly comes in contact with the parts of the plant, such as the seed and the roots of the plant. Error bars are included to show the relative error of the calculations.
Observed Experimental Results
Table 2 depicts the optimum and worst growing conditions that were observed during the data collection stage of the experiment.
Table 2. Conditions for Optimum and Worst Growth of Cherry Belle Radishes
|
Optimal Conditions for Height |
15%, 25 mL |
|
Optimal Conditions for Root Length |
10%, 25 mL |
|
Optimal Conditions for Weight |
10%, 25 mL |
|
Optimum Conditions for Germination |
10%, 25 mL |
|
Worst Conditions for Height |
10%, 5 mL |
|
Worst Conditions for Root Length |
5%, 5 mL |
|
Worst Conditions for Weight |
5%, 5 mL |
|
Worst Conditions for Germination |
5%, 5mL |
Conclusions
In conclusion, the project indicates that the optimum growth conditions for Cherry Belle Radishes are 10% biochar and 25 mL of water daily. The worst conditions for radish growth appear to be only 5% biochar and 5 mL of water added daily. It is not surprising that the more water added to the plants the larger they grew. It is important to note that the biochar was only helpful to the plant only up to a certain concentration, and then the results started to decline. This could be because of the necessary carbon to nitrogen ratios a plant need to grow.
The results are proof that the experiments purpose was well fulfilled. It is recommended that further experiments are performed. Some possible experiments are described below in the Recommendations section.
Recommendations
In order to improve the experiment, several changes could be made. To get better averages with more statistically significant results, more trials should be conducted within each independent variable. For example, this experiment had two trials within each variable set, whereas five would be a better number. However, the limited space for this experiment and limited supplies did not allow for such an extensive experiment.
Additionally, it is recommended that the light intensity in the lab be increased. The light intensity in the lab was much less stronger than the sun, so the plants did not grow to their full potential and tubers did not develop. It would also be helpful to lengthen the time frame of the experiment to see longer term effects of the biochar and water on the plant growth.
It is also recommended that the growing pots used are not compostable ones, because some of them started to deteriorate towards the beginning of the experiment. It is also recommended that the experiment be conducted outside to contain a more natural environment, even if the experimental conditions are less controlled. Further research is required to gain a better understanding of the interactions of biochar with radish growth.
References
- Anon: “Guidelines for Specifications of Biochars.” International Biochar Initiative(2011): 1-20. Web. 1 Feb 2015.
- NREL 2012
- Major, J. “Guidelines on Practical Aspects of Biochar Application to Field Soil in various Soil Management Systems.” International Biochar Initiative (2010): 1-23. Print.
- Trans, Pieter, and Ralph Keeling. “ESRL Global Monitoring Division – Global Greenhouse Gas Reference Network.” ESRL Co2 Trends RSS. National Oceanic and Atmospheric Administration. Web. 27 Apr. 2015. https://gml.noaa.gov/ccgg/trends/
- Woolfe, D., J. E. Amonette, F. A. Street-Perrott, J. Lehmann, and S. Joseph. “Sustainable Biochar to Mitigate Global Climate Change.” Nature Communications 1.5 (2010): 1-9. Print
- “Burpee Seeds and Plants for Home Gardening.” Burpee Seeds and Plants. W. Atlee Burpee & Co, 1 Jan. 2015. Web. 30 Apr. 2015.
- Anon: “Determination of Optimum Nutrient Element ratios in Plant tissue.” Taylor and Francis Online. N.p.,d. web 1 Feb. 2015.
- Anon: “Plant nutrients.” N.p., n.d. Web. 17 April. 2015.
- “Project Radish: Research.” Project Radish: Research. Web. 30 Apr. 2015.<http://www.pleasanton.k12.ca.us/avhsweb/thiel/creek/research/98/CaitDav/research.html>.
- M. B. Luebbe, T. R. Marrero. “Use of Azospirillum Brasilense, Biochar, and Water for Growth of Arabidopsis.” University of Missouri. May 5, 2014. Print
Appendices
-
Raw Experimental Data
The following tables show the raw data that was collected when the growing period ended. The label “NA” in a table means that the value was not measurable or applicable.
Table 3. Control Experimental Data
Control (50% Soil – 50% Compost)
Water
Trial
Observation
Height (cm)
Root Length (cm)
Weight (g)
# of Leaves
Color of Stem
Tuber?
Germination?
Other Observations
25 ml
Trial 1
5
24.2
0.2675
2
Light Red
N
Y
Muddy Soil
Trial 2
5
55
0.2913
2
Deep Red
N
Y
Very Long Tap Root
20 ml
Trial 1
4.8
22.1
0.4103
3
Deep Red
N
Y
Muddy Soil
Trial 2
5.2
18.6
0.3725
3
Deep Red
N
Y
Muddy Soil
15 ml
Trial 1
NA
NA
NA
NA
NA
N
N
Wet to the Bottom
Trial 2
6.3
17
0.3968
3
Deep Red
N
Y
Soil was muddy
10 ml
Trial 1
2.8
6.7
0.1464
2
Deep Red
N
Y
Top 1″ of soil was moist
Trial 2
8.6
8
0.3844
4
Deep Red
N
Y
Soil was wet to the bottom
5 ml
Trial 1
2.1
3.7
0.1434
2
Light Red
N
Y
Top 1/2″ of soil was moist
Trial 2
3.3
5.5
0.1106
2
Light Red
N
Y
Top 1/2″ of soil was moist
Table 4. 5% Biochar Experimental Data
50% Soil – 45% Compost – 5% Biochar
Water
Trial
Observation
Height (cm)
Root Length (cm)
Weight (g)
# of Leaves
Color of Stem
Tuber?
Germination?
Other Observations
25 ml
Trial 1
4.5
7.1
0.2507
4
Red
N
Y
Soil Moist To Bottom
Trial 2
5.2
7.3
0.185
2
Pink
N
Y
Soil Moist To Bottom
20 ml
Trial 1
3.4
5.1
0.0923
3
Red
N
Y
Soil Moist 1.75″ Down
Trial 2
5.6
7
0.3011
4
Deep Red
N
Y
Soil Moist 1.75″ Down
15 ml
Trial 1
5.5
5.7
0.2433
2
Pink
N
Y
Soil Moist 1″ Down
Trial 2
3
4.6
0.1713
3
Red
N
Y
Soil Moist 1.25″ Down
10 ml
Trial 1
NA
NA
NA
NA
NA
N
N
Soil Moist 1/2″
Trial 2
NA
1.4
0.0605
NA
NA
N
Y
Never Made it Above Surface
5 ml
Trial 1
NA
1.8
0.0201
NA
NA
N
Y
Never Made it Above Surface
Trial 2
NA
NA
NA
NA
NA
N
N
Soil is Dry
Table 5. 8% Biochar Experimental Data
50% Soil – 42% Compost – 8% Biochar
Water
Trial
Observation
Height (cm)
Root Length (cm)
Weight (g)
# of Leaves
Color of Stem
Tuber?
Germination?
Other Observations
25 ml
Trial 1
5.2
6.1
0.2647
3
Pink
N
Y
Trial 2
4.5
8.5
0.2514
4
Pink
N
Y
20 ml
Trial 1
3.2
6.3
0.1514
2
Red
N
Y
Trial 2
5.7
4.2
0.335
4
Pink
N
Y
15 ml
Trial 1
2.2
5.4
0.2466
3
Red
N
Y
Trial 2
5.4
3.6
0.1699
2
Red
N
Y
10 ml
Trial 1
3.4
4.1
0.2256
3
Light Pink
N
Y
Trial 2
3.3
2.3
0.121
2
Yellow/Green
N
Y
5 ml
Trial 1
NA
1
0.0399
NA
NA
N
Y
Trial 2
NA
NA
NA
NA
NA
N
N
Table 6. 10% Biochar Experimental Data
50% Soil – 40% Compost – 10% Biochar
Water
Trial
Observation
Height (cm)
Root Length (cm)
Weight (g)
# of Leaves
Color of Stem
Tuber?
Germination?
Other Observations
25 ml
Trial 1
5.2
12.7
0.3892
3
Pink
N
Y
Trial 2
5.7
16.4
0.571
2
Red
N
Y
20 ml
Trial 1
5.3
6.1
0.2609
3
Red
N
Y
Trial 2
5.3
10.4
0.3177
4
Light Pink
N
Y
15 ml
Trial 1
5.2
4.6
0.242
3
Red
N
Y
Trial 2
3.8
4.1
0.1786
2
Red
N
Y
10 ml
Trial 1
2.4
2.1
0.104
2
Green
N
Y
Trial 2
3.3
3.4
0.2063
4
Reddish
N
Y
5 ml
Trial 1
2.4
2
0.096
2
Yellow
N
Y
Trial 2
NA
2
0.0286
NA
NA
N
Y
Table 7. 12% Biochar Experimental Data
Water
Trial
Observation
Height (cm)
Root Length (cm)
Weight (g)
# of Leaves
Color of Stem
Tuber?
Germination?
Other Observations
25 ml
Trial 1
4.7
8.9
0.4707
3
Red
N
Y
Trial 2
4.4
7.8
0.2741
2
Red
N
Y
20 ml
Trial 1
NA
NA
NA
NA
NA
N
N
Trial 2
4.5
7.4
0.2901
3
Red
N
Y
15 ml
Trial 1
4.7
6.8
0.3348
3
Red
N
Y
Trial 2
4.3
5
0.2613
4
Red
N
Y
10 ml
Trial 1
3.4
4.1
0.1425
3
Light Pink
N
Y
Trial 2
3
3.7
0.1921
4
Red
N
Y
5 ml
Trial 1
NA
NA
0.0103
NA
NA
N
Y
Trial 2
NA
NA
0.0204
NA
NA
N
Y
Table 8. 15% Biochar Experimental Data
50% Soil – 35% Compost – 15% Biochar
Water
Trial
Observation
Height (cm)
Root Length (cm)
Weight (g)
# of Leaves
Color of Stem
Tuber?
Germination?
Other Observations
25 ml
Trial 1
5.6
20.3
0.2835
2
Light Pink
N
Y
Trial 2
6.2
8.5
0.3047
2
Light Pink
N
Y
20 ml
Trial 1
3.7
5.9
0.2975
4
Light Pink
N
Y
Trial 2
6.6
5.8
0.2948
3
Light Pink
N
Y
15 ml
Trial 1
5.7
6.6
0.346
2
Red
N
Y
Trial 2
5.2
4.7
0.2718
4
Light Pink
N
Y
10 ml
Trial 1
4.3
5.1
0.1966
2
Light Pink
N
Y
Trial 2
3.7
4.1
0.1487
2
Light Pink
N
Y
5 ml
Trial 1
NA
5.5
0.159
NA
NA
N
Y
Trial 2
NA
1
0.008
NA
NA
N
Y
-
Data Tables and Graphs
The following tables and figures show the averages of the trials divided by dependent variable. The accompanying bar graphs show the graphical results of the tabulated values.
Assessment of Water and Biochar on Cherry Belle – Dakota Botts
Average Height vs. % Biochar
Composition
Average
0
4.79
5
4.53
8
4.11
10
4.29
12
4.14
15
5.13
Average Height vs. % Biochar
Composition
Average
0
4.79
5
4.53
8
4.11
10
4.29
12
4.14
15
5.13
-
2. Data Tables and Graphs